A phase diagram of Co–Cr–W–C alloy overlay welded on 1Cr18Ni9
Introduction
The Co–Cr–W–C alloy is a kind of relatively recently developed wear-resistant layer of welding material with high hardness and strength, excellent corrosion resistance, wear resistance and a certain high temperature resistance, which has been widely used in the field of wear-resistant alloy. The microstructure and phase composition of welding layer directly affects the performance of wear-resistant alloy material. Therefore, the phase diagrams of the alloy overlay welding layer or coating layer based on Co–Cr–W–C alloy are of great significance to the research and application process of the alloy.
This paper studies the phase diagram of Co–Cr–W–C alloy overlay welded on 1Cr18Ni9. The Co–Cr–W–C alloy is composed of Co, Cr, W and C elements in a certain mass fraction. Thermal analysis and X-ray diffraction (XRD) are used to analyze the phase composition of the welded overlay layer on the 1Cr18Ni9. The crystal structure of the overlay layer is observed by scanning electron microscope (SEM). The microstructure is studied by optical microscope. The fraction of each element in the alloy is determined by energy disperse spectroscopy (EDS). The phase diagram of Co–Cr–W–C alloy overlay welded on 1Cr18Ni9 is determined.
Methodology
The welding technology of Co–Cr–W–C alloy on 1Cr18Ni9 steel plate is mainly GMA welding. The welding rod used in the experiment is an anti-wear welding rod. The rod material is covered with chromium-carbon coating, and is mainly composed of Co, Cr, W and C elements. The chemical composition of the welding rod used in the experiment is shown in Table 1.
Table 1. Chemical composition of welding rod (wt %).
Elements Chemical composition (%) Co 65.6 Cr 15.1 W 17 C 2.3
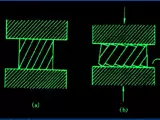
The 1Cr18Ni9 steel plate is used as the matrix material of the Co–Cr–W–C alloy overlay layer. The thickness of the welded layer is 2.5 mm. The welding process of Co-Cr-W-C alloy overlay on 1Cr18Ni9 steel plate is shown in Figure 1. The welding current is 100A and the welding voltage is 16V.
Fig. 1. Welding process of Co–Cr–W–C alloy overlay on 1Cr18Ni9 steel plate.
After welding, the samples are subjected to thermal analysis and X-ray diffraction (XRD) tests in order to qualitatively analyze the phase composition of the welded layer. The sample is first heated and kept at 500˚C for 30 minutes, and then cooled to room temperature at a rate of 5˚C/min. Then, the XRD field scan test is carried out to obtain the crystal structure information of the welded layer. SEM and EDS are used to observe the microstructure information and fraction of each element in the alloy respectively.
Results and discussion
Table 2 shows the thermal analysis results of the alloy overlay layer. In the initialization stage, the melting peaks of CoCr (Cr23C6) and WC appear. The melting peaks of Co, Cr, W and C are observed in the middle stage. At the termination stage, the melting peaks of Co and Cr merged into one peak, and W melting peak continues to shift to the right.
Table 2. Thermal analysis results of the alloy overlay layer.
Stage Temperature (˚C) Melting peaks Initialization 900 CoCr, WC Middle 1100 Co, Cr, W, C Termination 1400 Co, Cr
Fig. 2 shows the XRD results of the alloy overlay layer. The welded layer contains Co, Cr, W and C complexes, and it is speculated that the complexes may be CoCr2, M7C3 and W2C.
Fig. 2. XRD result of the alloy overlay layer.
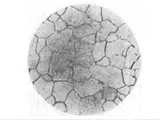
Fig. 3 shows the SEM observation of the microstructure of the alloy overlay layer. The welded layer consists of spherical granular crystal structure. Through the SEM microstructure observation, the CoCr2 and M7C3 in the matrix of the welded layer were confirmed.
Fig. 3. SEM observation of the microstructure of the alloy overlay layer.
Elements Co Cr W C Mass fraction, weight % (w/w) 58.6 28.1 11.9 1.4
Table 3 shows the EDS analysis results of the elements in the alloy overlay layer. According to the results of thermal analysis, XRD analysis and EDS analysis, the mass fraction of Co, Cr, W and C in the alloy overlay layer was calculated, and the phase diagram of the welded layer was determined.
Table 3. EDS analysis results of elements in alloy overlay layer.
Fig. 4 is the phase diagram of the Co–Cr–W–C alloy overlay layer welded on 1Cr18Ni9 which was determined based on the chemical composition of the alloy overlay layer. In the phase diagram, Co–Cr–W–C complex phase, CoCr2 and M7C3 are all present.
Fig. 4. Phase diagram of Co–Cr–W–C alloy overlay layer on 1Cr18Ni9.
Conclusion
The phase diagrams of Co–Cr–W–C alloy overlay welded on 1Cr18Ni9 steel plate were obtained by thermal analysis, XRD, SEM and EDS in this paper. The results show that Co–Cr–W–C complex phase, CoCr2 and M7C3 are all present in the welded layer, which determines the characteristics of the alloy overlay layer for anti-wear and corrosion resistance with higher hardness and strength. The phase diagrams provide important reference for application of Co–Cr–W–C alloy in the field of wear-resistant alloy.